Fiona Dee
Portfolio
About me
I’ve just completed General Assembly’s Data Science Immersive course. Three months of full-time, full-on learning! It has been an awesome experience, giving me a solid foundation to build on as I learn and grow.
My background is in IT, working with people, processes, and data. After spending so many years as a Business Analyst and technology generalist, I wanted to pursue more technical roles and decided to upskill in data science tools and techniques.
I’m looking forward to building my skills through experience and collaboration.
Recent Projects
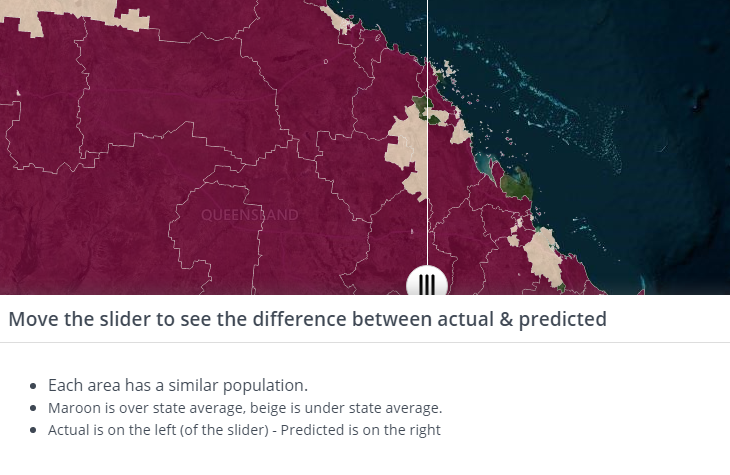
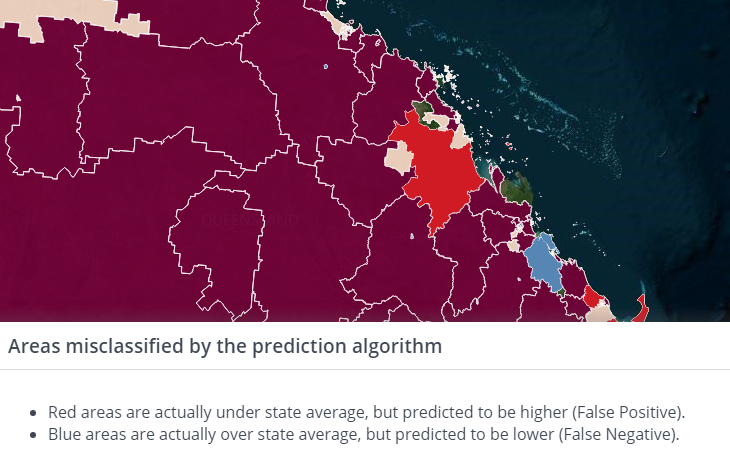
Volunteering Rates in Australia: Feature Selection & Machine Learning (ML)
July 2021
Predict which geographic areas have a volunteering rate above or below the Queensland state average. Identify significant features for predicting volunteering rates of geographic areas.
◆ Models: Regression, Classification &, Ensemble
◆ Dataset: sourced from Australian Bureau of Statistics (ABS), 2016 Census
◆ Tools: Jupyter Notebook & Python, SQLite
◆ Libraries: Scikit-learn, Pandas, Statsmodels, Seaborn, Matplotlib
If you would like to play on the map itself:
- Click on the link below
- On the popup, “Close” to stay on this map
- On the ‘This map contains a story’, “Yes” to view the story
Data Science Immersive (DSI) projects
Course projects with specified data and goals.
◆ Tools: Jupyter Notebook & Python, Scrapy & spiders
◆ Libraries: Scikit-learn, Pandas, SciPy, Numpy, Seaborn, Matplotlib
Link to jupyter notebooks for these projects
Web Scraping, Natural Language Processing (NLP) & Evaluate models
June 2021 • dsi-project-4
For data-related jobs: identify factors which impact salary and distinguish job category. Scrape my own dataset from Seek.com.au
Dataset: 12,000 jobs scraped from Seek.com.au
Feature Engineering & Machine Learning (ML) Regression models
May 2021 • dsi-project-3
Given sales and property information: estimate the sale price of properties based on their “fixed” characteristics, and the impact of possible renovations.
Dataset: Ames housing data
Exploratory Data Analysis (EDA) & Hypothesis testing
April 2021 • dsi-project-2
For this project, learn about and understand the data, through summary statistics and visualization. Then devise testable hypotheses that could point in specific policy directions.
Datasets: SAT_scores & drug-use-by-age
Coding Challenges
April 2021 • dsi-project-4
Palindrome • Primes • Fizzbuzz • String compressor • File handling